Every product has a carbon footprint associated with its life cycle; greenhouse gas emissions occur at each step from the extraction and transportation of raw materials, to manufacturing, usage and finally disposal of the product. Calculating the precise carbon footprint of a product is difficult since source materials and product manufacturing typically involve several suppliers who may provide limited insights into their processes or associated emissions. The lack of high quality data on the carbon footprint of the products we purchase is a key challenge to reduce our emissions. Having a detailed understanding of our carbon footprint is essential to make informed decisions around sustainable sourcing and design.
Emissions from the IT hardware Meta uses in our data centers are a major component of our carbon footprint: In 2023, our carbon footprint was 7.5 M metric tons of CO2e, including 4.8 M for capital goods, which includes IT hardware purchases (see Meta’s 2024 Sustainability Report). The emissions from IT hardware usage (‘operational emissions’) are relatively easy to estimate, since usage is primarily the energy consumption that can be directly measured. However, the emissions associated with manufacturing and transportation (‘embodied emissions’) are harder to quantify due to limited information about the full picture of the supply chain.
We are focused on reducing our emissions to reach net zero emissions across our value chain in 2030, and having a detailed understanding of which components in our IT hardware have the largest impact and potential for significant emissions reduction is imperative to achieve our goal. To this end, we developed a methodology to estimate and track the carbon emissions of hundreds of millions of components in our data centers. This is a continuously ongoing effort to improve the accuracy of quantifying our emissions as well as to identify specific opportunities to reduce our emissions.
Common methods to estimate embodied carbon emissions
Embodied carbon emissions are typically estimated using either cost-based estimates (i.e., Environmental Extended Input-Output “EEIO” multiplication factors of CO2e per $ spent in different product categories) or product-specific Life Cycle Assessments (LCAs), which consist of detailed studies of emissions throughout the life-cycle processes of a given product. Cost-based estimates are easy to use, but can be inaccurate since they do not include product specifics and do not allow for optimization. Cost-based solutions also do not easily enable us to quantify emissions reductions other than through spending less money. Product specific LCAs are currently our highest quality data for embodied carbon emissions estimates as they are independently reviewed and are significantly more detailed and accurate. However, they take time and resources to perform and are not scalable to apply to all categories of components.
A data and model-driven solution
There are tens of thousands of unique products in our server fleet that amount to hundreds of millions of assets in our data centers. While some parts may have low embodied carbon emissions, a sheer quantity of these components can result in significant emissions. For example, the total embodied emissions of the Dual In-Line Memory Modules (DIMMS) in our server fleet are one of the largest emissions sources from a single component, despite some components having a much higher per-device emission factor compared to DIMMs. Hence, focusing only on high-intensity emitters would obscure the impact of components such as the DIMM memory modules. This underscores the necessity of a multi-granularity approach in our emissions analysis, ensuring we capture both high-volume, low-emission parts and low-volume, high-emission parts to fully understand our impact at the fleet level and making sustainable decisions when designing new racks.
To solve this problem at Meta and get detailed insights into our embodied carbon emissions, we developed a data framework where we obtained a ‘best estimate’ embodied emission factor for each of the unique IT hardware components in our data centers. The components vary from fully assembled servers to individual assets such as chips, cables, and screws. This granular approach enables us to conduct more detailed analyses to enable lower carbon designs.
Model-derived estimates of carbon emissions
A main issue of estimating carbon emissions in this comprehensive manner is that for most components, an embodied carbon emission factor is not available. To mitigate this, we developed a range of methods to ensure that we have an emissions estimate for each component. Some estimates will be more accurate than others and thus we define an associated hierarchy of ‘data quality’ corresponding to the qualitative rank of the accuracy of the method used to obtain these estimates. We use component-level cost based estimates as the lowest ‘data quality’ and product-specific LCAs provided by the suppliers as the highest. We complement calculations with internally developed materials modeling and third party tools and databases such as the imec.netzero tool for semiconductors and the ACT tool. While semiconductors have a significant carbon footprint and have been the focus of many studies, the large amount of non-semiconductor components adds up to a significant amount of emissions and thus need to be modeled as well. Finally, we have also developed methodologies to aggregate estimates of different components into the physical assemblies that combine them, such as servers or racks.
This approach of developing a suite of methods and the associated data pipelines allows us to get a comprehensive and very detailed overview of the embodied carbon in our entire IT hardware fleet. Additionally, it allows us to aggregate this data from individual components up to the level of a rack assembly, depending on available information. Our strategy is to enable a quick emission calculation for each of our IT components and subsequently update the emission factors in a continuous manner when improved data becomes available. This approach allows us to deploy emission reduction efforts while simultaneously improving the underlying data. Example use cases of the data include detailed and scalable carbon accounting, emissions forecasting (including the impact of a supplier’s or manufacturer’s reduction efforts), project estimated emissions of new hardware designs, code optimization based on minimizing embodied carbon, and tracking the fleet level impact of component level decisions.
The diagram showing the Grand Canyon Type 5 storage rack below illustrates our approach. This component is used for hard drive-based storage and the detailed specification has been shared in the Open Compute Project here.
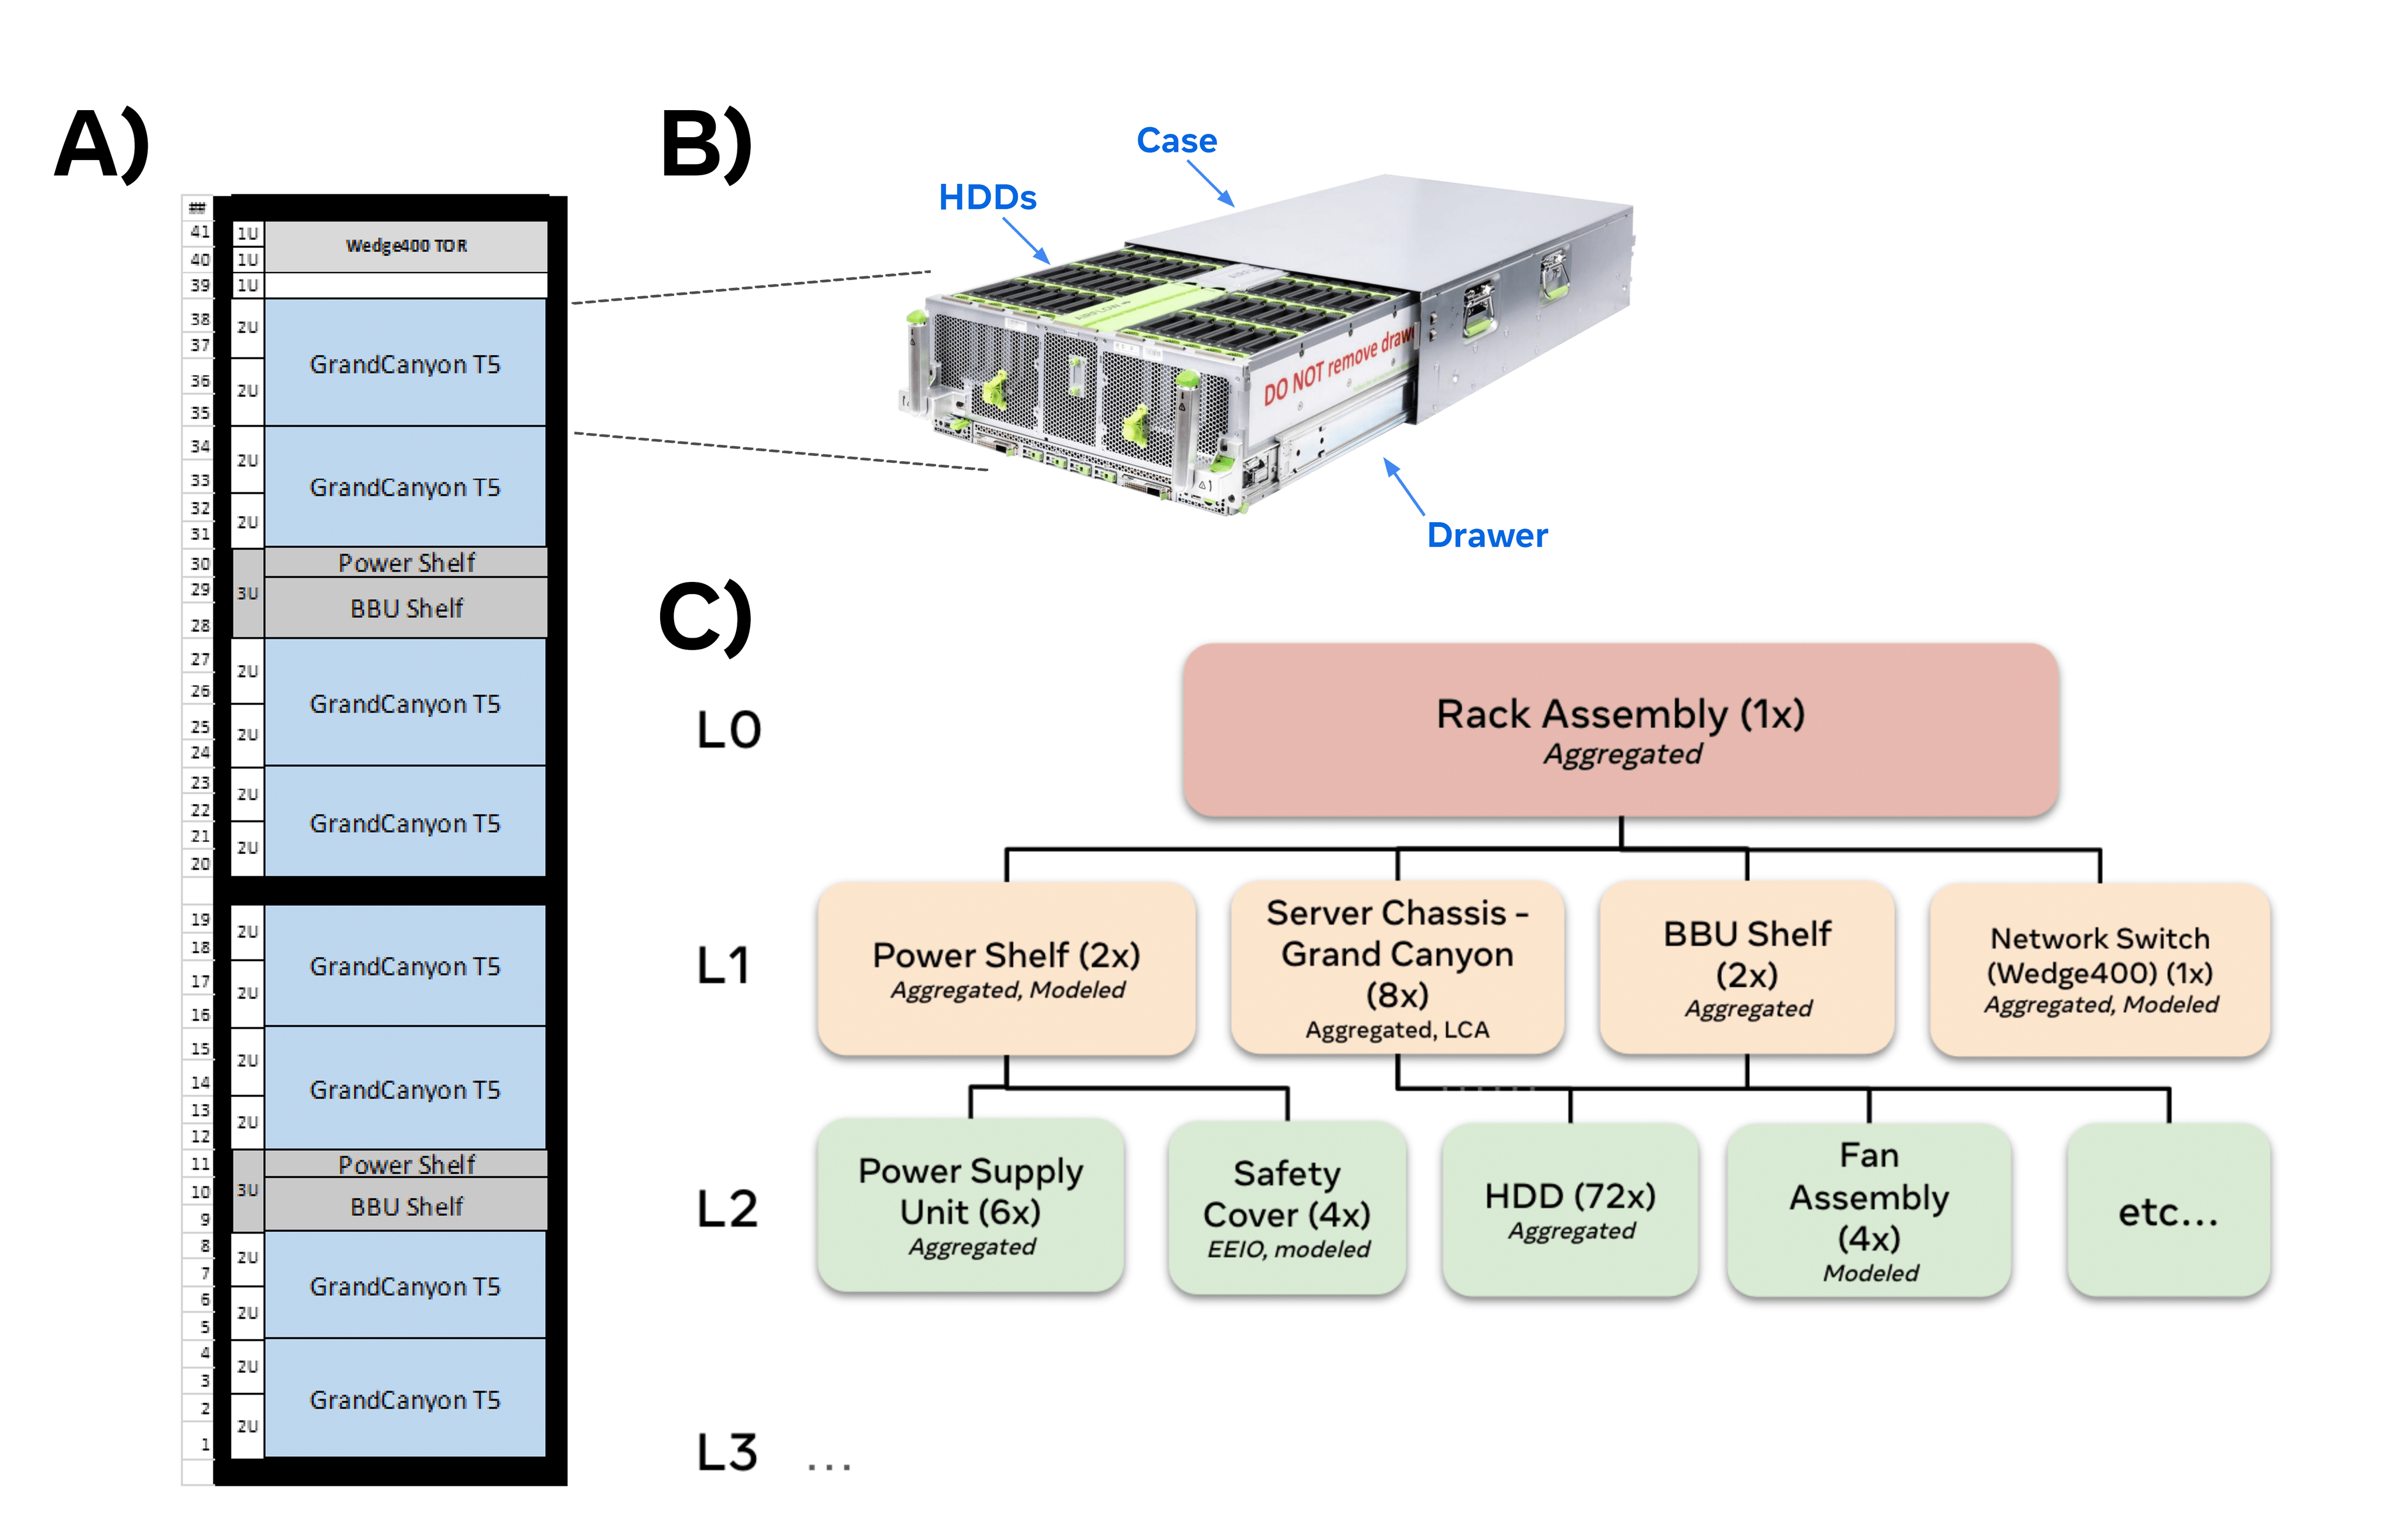
Figure 1: Example rack assembly configuration for an OCP Grand Canyon rack configuration.
- Figure 1a shows the configuration of a rack containing one switch, two power shelves, 8 servers and 2 BBUs.
- Figure 2b shows a photo of a server with some of the 72 hard disk drives visible.
- Figure 1c shows how this rack would be represented in our approach. The italic text shows an example of a potential source of the embodied carbon emissions estimates.
This rack assembly is a collection of hardware components that work together to provide high-density storage and networking capabilities. Each rack has a network switch (Wedge400 TOR), power shelves, battery backup units (BBUs) and Grand Canyon servers. Each of these components are composed of sub-components (e.g., the server has 72 harddisk drives (HDD), fans, a network interface card (NIC), etc.).
The estimation of the Grand Canyon T5’s embodied carbon footprint is conducted through considering each component. This rack in particular comprises thousands of parts, with over a hundred unique items. We determine the carbon impact of each part and aggregate with a methodology acknowledging the level of fidelity of the calculation. The schematic in Figure 1 shows how a storage rack assembly would be represented in our approach.
To calculate embodied carbon for the whole fleet, we run these calculations for all the racks we purchased. We recently generated this dataset for all the components we purchased in 2023, which was used to calculate this year’s carbon footprint. Our GHG emissions data and the approach outlined in this blog undergo limited assurance conducted by a third-party.
Example analyses
The figures below illustrate some insights which can be gained from the data. The figures are generated with random data and are meant to illustrate the capabilities of this approach rather than the actual outcomes.
Figure 2 below shows how we can analyze the distribution of the embodied carbon emissions by different category types as well as rack types in our fleet. This enables us to identify hotspots in the sources of emissions as well as identify the importance of addressing a certain category of components or types of racks instead of just isolated components. It also emphasizes the complexity of the dataset and need for comprehensive analysis as opposed to focusing on just a few parts.
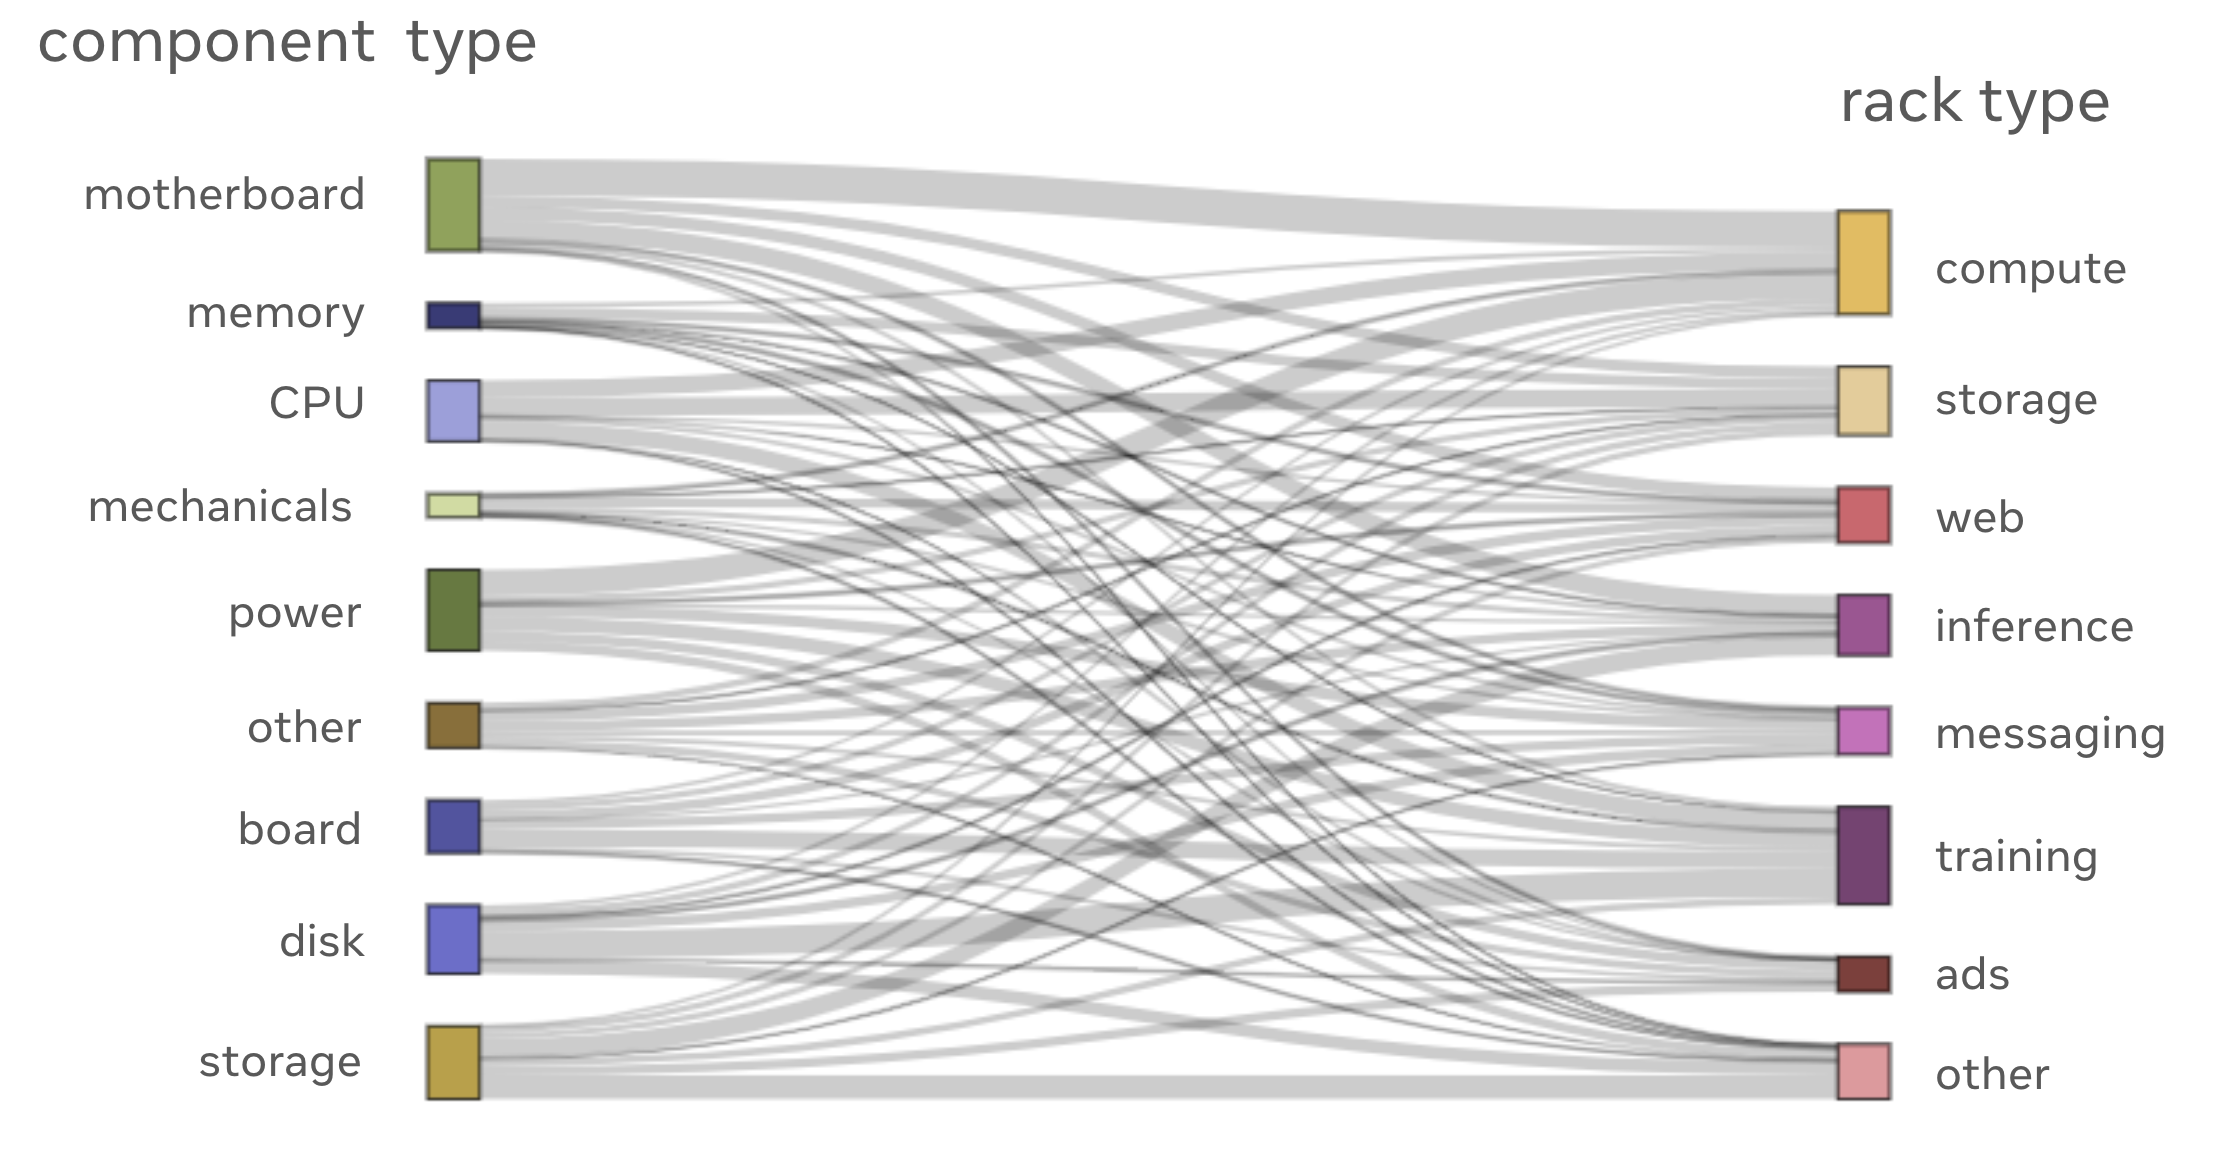
Figure 2: An example breakdown of the emissions associated with different component types or rack types. This visualization shows the complexity of the sources of embodied carbon emissions contributing to the total emissions and how a granular approach can help to develop various insights in carbon accounting and reduction opportunities. Note that the data and labels used for this graph are randomly generated and for illustrative purposes only.
Figure 3 shows how we can dissect the largest emissions by progressively going deeper in the tree of components; in this case, by business unit, component categories, manufacturer, and model type. This is an example of one of the components which contributes significantly to the total emissions (~0.7%) and how this is broken down into different categories.
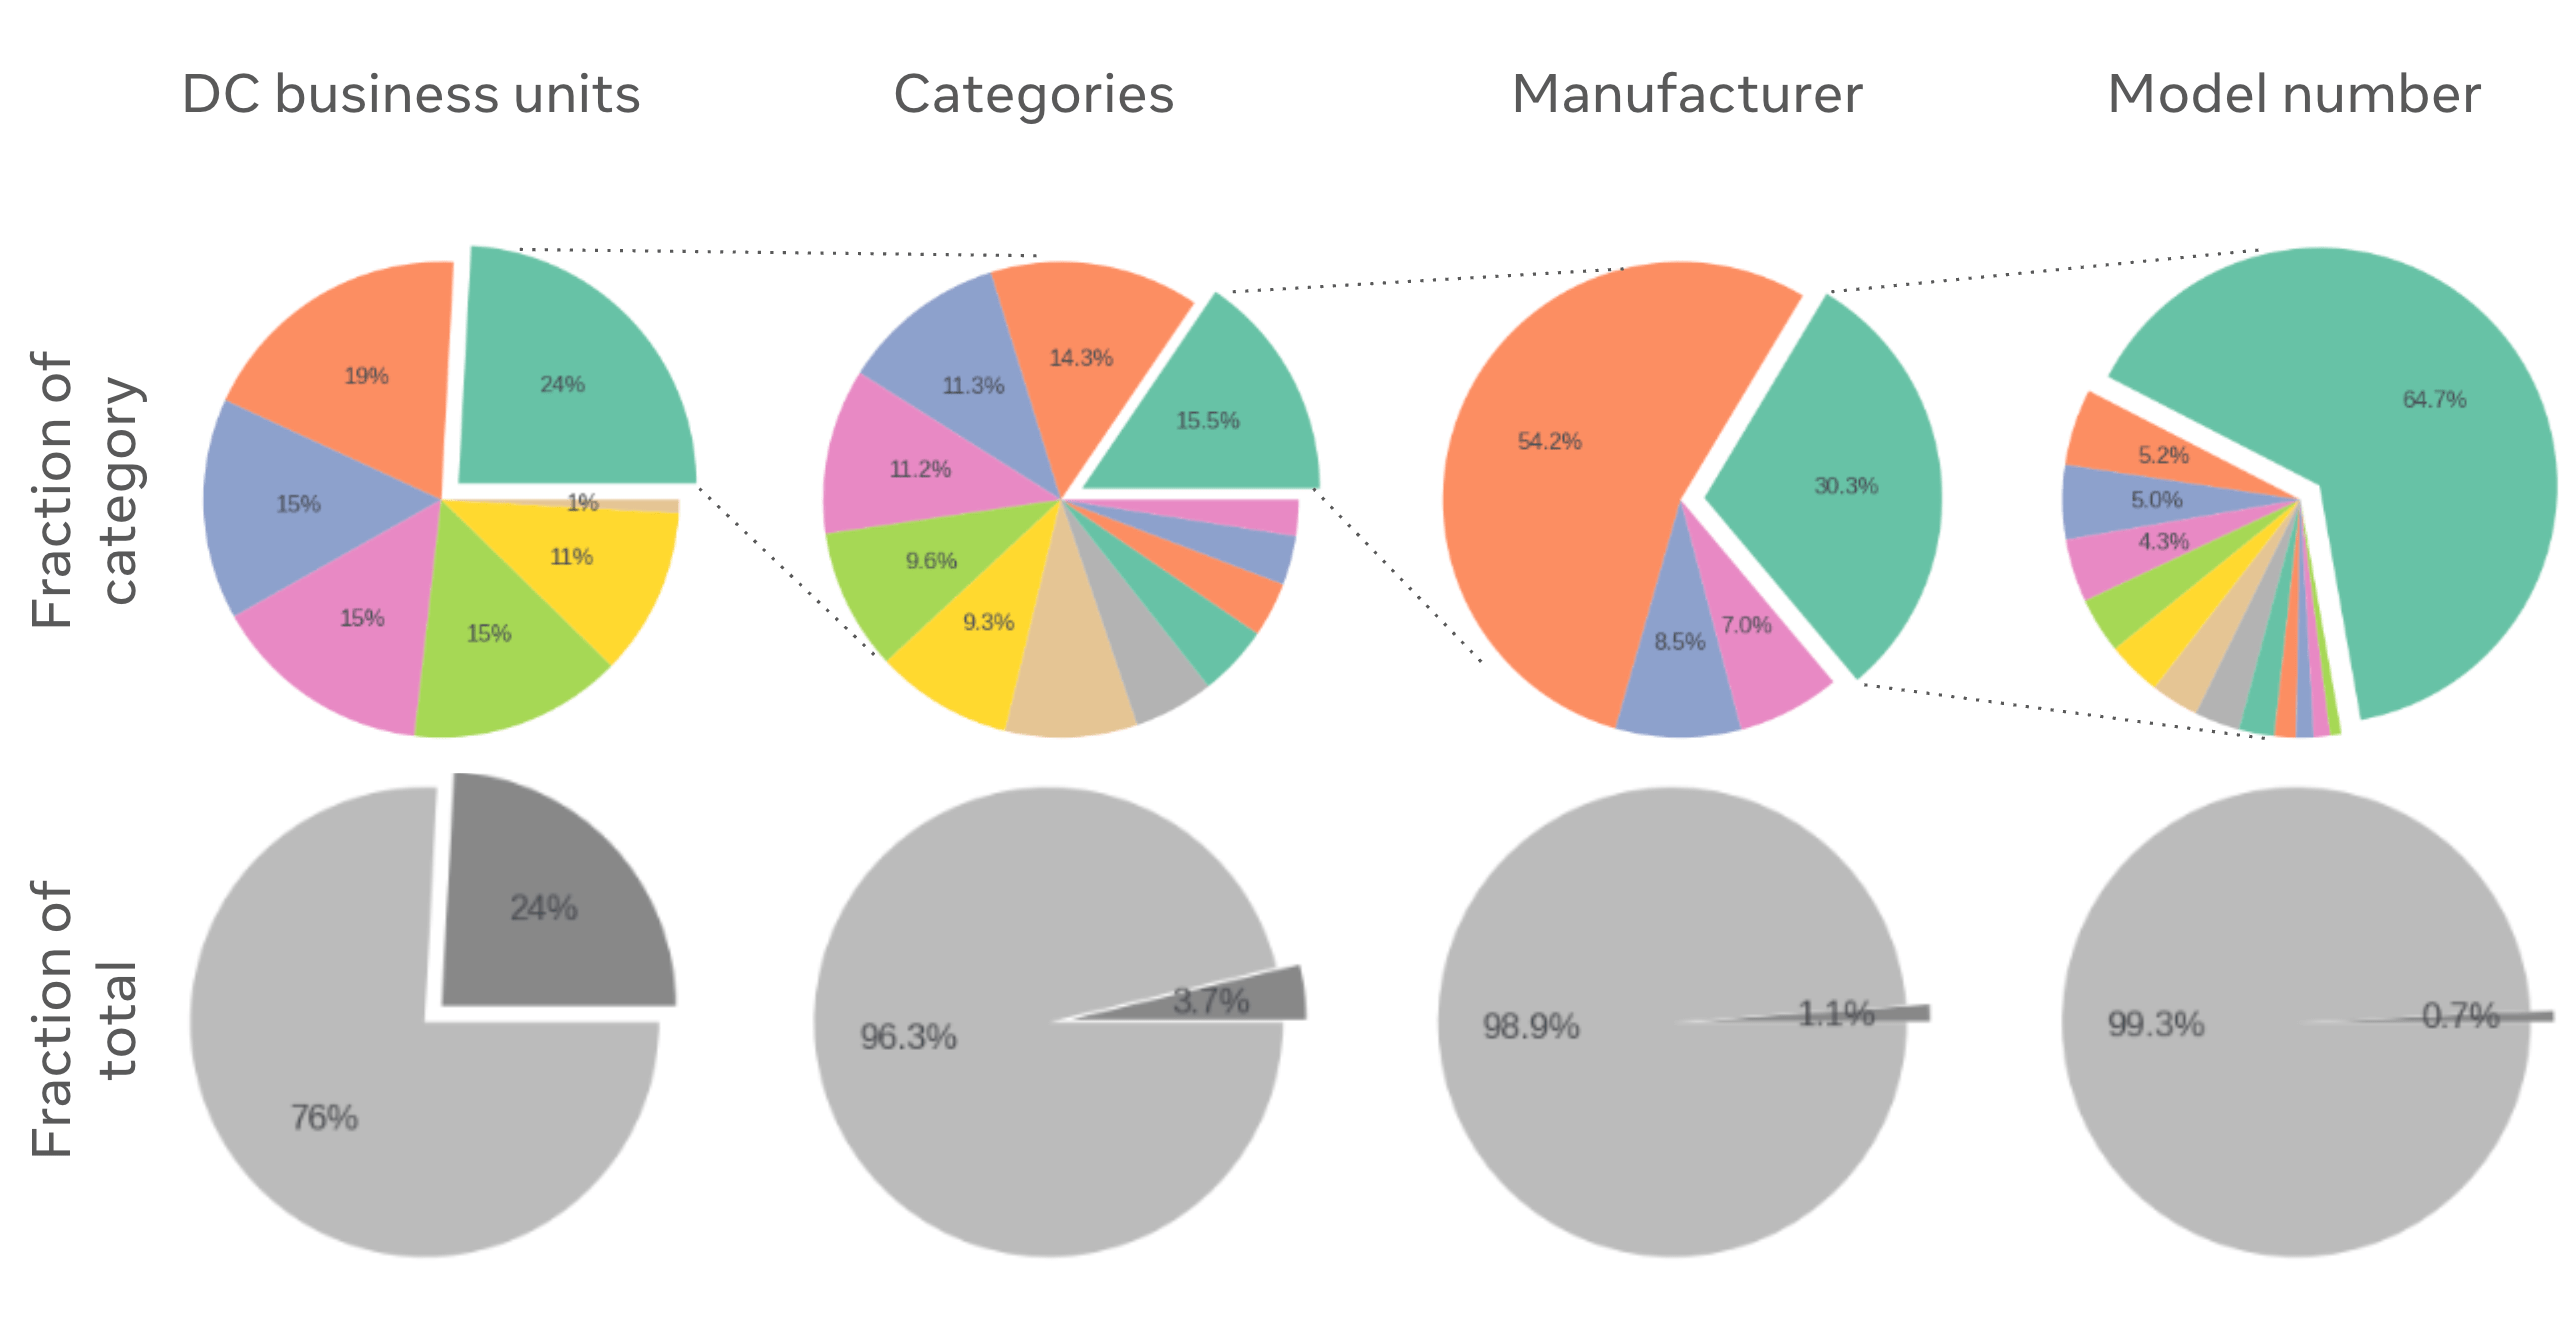
Figure 3: Another example of how the embodied carbon emissions database can be used to provide insights in carbon reduction opportunities. Here, an example is shown where a component which by itself contributes to 0.7% of the total emissions and the manufacturer to 1.1% of the total emissions. This can help inform strategies if more sustainable component models, or manufacturers are the right strategy for overall emissions reduction. Note that the data and labels used for this graph are randomly generated and for illustrative purposes only.
Finally, another use-case is to have accurate accounting of our fleet’s embodied carbon emissions. Given the large number of components in our fleet, it is very important to account for the total volume of certain components to know their aggregate emissions. We find that the distribution of emissions per component-type typically has a very large tail (i.e., many component types which are relevant to include in the analysis), and to cover ~95% of the total carbon footprint in 2023, we need estimates for thousands of unique components. This breadth of components motivates the approach to perform a comprehensive analysis for estimating embodied carbon emissions to enable us to prioritize where to improve data quality.
Conclusion
We built a data-driven approach to quickly enable highly granular insight into the embodied carbon emissions of our data center IT hardware. This enables accurate accounting and prioritization of the most impactful emissions reduction interventions. This approach supports today’s needs to reduce emissions while continuously improving as we move toward obtaining higher quality data, such as embodied carbon estimates provided by suppliers and manufacturers who are best positioned to complete those calculations.
While our approach to calculate emissions with varying levels of quality enables us to make progress fast, it is important to note that the (open) availability of high-quality embodied carbon emission data, ideally provided by manufacturers through Life Cycle Assessments (LCAs), would significantly accelerate end-users’ efforts to reduce their emissions. We encourage manufacturers to share their LCA data for each component, as this would greatly enhance the accuracy and reliability of our calculations and drive the data center industry toward more sustainable practices.
News
Get the latest news about our sustainability work, download reports and resources and explore our energy dashboards.

Meta launches 2024 Sustainability Report
Meta is proud to share its 2024 Sustainability Report highlighting the progress we’ve made towards our net zero, climate, water, energy and supply chain goals and commitments.
August 28, 2024
RETINAS: Real-Time Infrastructure Accounting for Sustainability
Actionable metrics to help reduce emissions by improving our utilization and efficiency of Meta’s data center server fleet.
August 26, 2024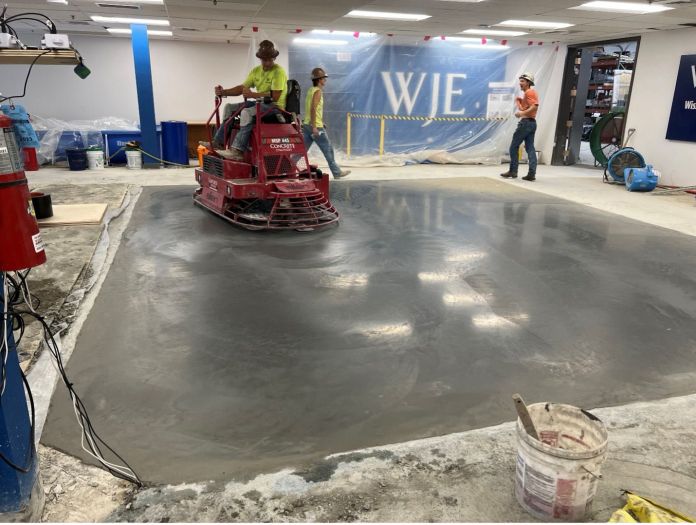
Leading data center companies partner with Open Compute Project Foundation and WJE to trial Green Concrete!
A new collaboration to test the development and deployment of low-carbon concrete.
August 30, 20242025 Sustainability Report
Learn more about our progress as we work to achieve net zero emissions across our value chain and become water positive in 2030.